Clinical Evidence for PVI*
PVI has been shown to predict fluid responsiveness, defined as a significant increase in cardiac output after fluid administration.**
- > PVI > 14% prior to volume expansion is highly predictive that a patient will respond to fluid administration (81% sensitivity)
- > PVI < 14% prior to volume expansion is highly predictive that a patient will not respond to fluid administration (100% specificity)
* Adapted from Cannesson M. et. al. Br J Anesth 2008;101(2):200-206
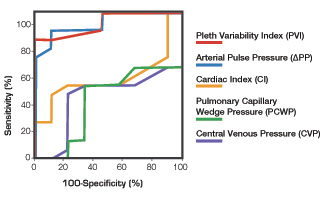
** PVI showed a similar accuracy (0.93 area under the curve, AUC) vs. pulse pressure variation from an invasive arterial catheter (0.94) and superior accuracy vs. cardiac index (0.56), central venous pressure (0.42), and pulmonary capillary wedge pressure (0.40).
PVI Calculation: How It Works
Perfusion Index (PI) is the ratio of nonpulsatile to pulsatile blood flow through the peripheral capillary bed. PVI is an automatic measure of the dynamic change in PI that occurs during the respiratory cycle.

The greater the PVI, the more likely the patient will respond to fluid administration.